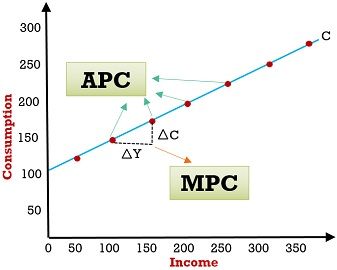
 APC and MPC are two concepts in economics, which sound similar. However, while average propensity to consume (APC) can be described as the fraction of aggregate consumption to aggregate income, marginal propensity to consume (MPC) is the fraction of change in the consumption expenses, to income.
What is Propensity to Consume?
Propensity is the inclination towards something that drives your behavior in a definite manner. So propensity to consume is the drive to consume corresponding to income. It measures how consumption and income are related quantitatively. To put it simply, the propensity to consume is the schedule that reflects the consumption level at different levels of income in the economy.
Types of Propensity to Consume
- Average Propensity to Consume (APC)
- Marginal Propensity to Consume (MPC)
In this section, we will talk about the difference between APC and MPC along with examples.
Content: APC Vs MPC
Comparison Chart
| Basis for Comparison | Average Propensity to Consume (APC) | Marginal Propensity to Consume (MPC) |
|---|---|---|
| Meaning | Average Propensity to Consume (APC) is the ratio between total consumption and total income. | Marginal Propensity to Consume (MPC) is the ratio between additional consumption and additional income. |
| Indicates | Consumption per unit of total income. | Consumption per unit of additional income. |
| Slope of Consumption function | Not indicated by APC | Indicated by MPC |
| Zero | APC can never be zero | MPC can be zero |
| Represented as | Any point on the consumption curve | Difference between two points on the curve |
Definition of Average Propensity to Consume (APC)
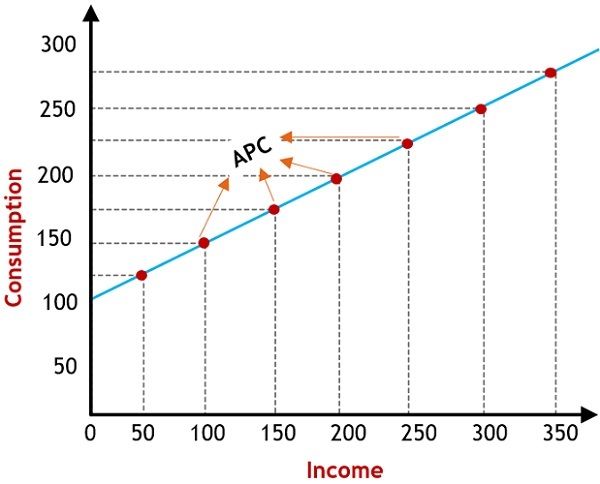
Average Propensity to Consume (APC), refers to that part of income that is spent on consumption is termed as APC. It measures the relationship between consumption with respect to a specific level of income, in quantitative terms. The ratio of consumption with respect to disposable income is called Average Propensity to Consume. It determines the part of income spent on consumer goods and services. It is denoted by:![]()
where, C stands for consumption, and
Y is used to express disposable income.
Let us understand the concept with the given schedule: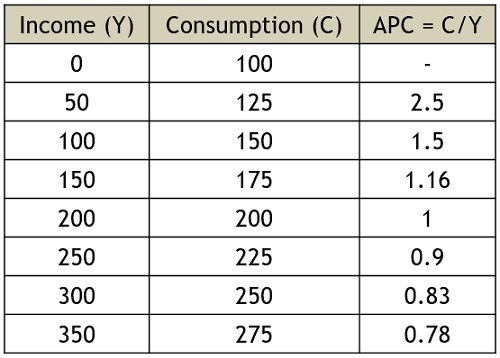
We have understood that:
- At first Average Propensity to consume is more than 1 because the consumption of goods is greater in comparison to the income earned. And as long as the consumption is more than income, it will continue to be more than one.
- Next, when the consumption is equal to income, APC is equal to 1.
- As the consumption is less than the income, APC is less than 1 and it continues to decrease as the income increases.
- One thing is to be noted here that APC cannot be zero (0) as the consumption can never be zero or negative.
- APC lies between zero (0) to infinity (∞), i.e. (0 < APC < ∞).
- Each point in the consumption curve is APC, as it shows the ratio between consumption and income.
Also Read: Difference Between Budget Line and Budget Set
Definition of Marginal Propensity to Consume (MPC)
Marginal Propensity to Consume shortly known as MPC implies the relationship between change in consumption and change in income, in quantitative terms. It is obvious that consumption increases with the increase in income and so there is a direct relationship between income and consumption.
It shows the ratio of additional income that is spent on consumption, i.e. it measures the response of consumption spending with respect to changing income levels. The different factors affecting the consumption spending are:
- Change in the wage level
- Changes in the fiscal policy of the government
- Relative prices of goods
- Windfall gains and losses
- Change in the attitude and expectations of the consumers
- Change in interest rate, etc.
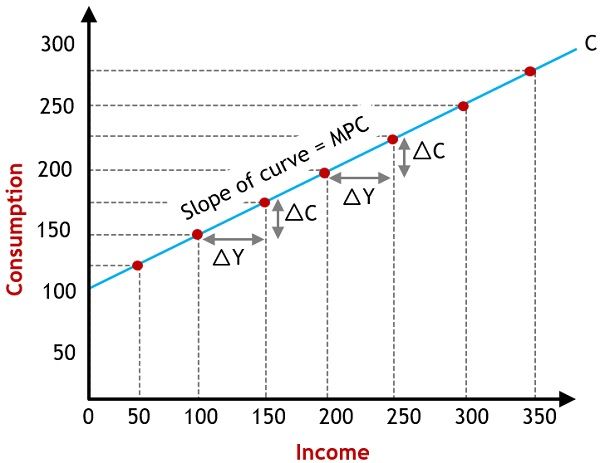
So, the MPC measures the rate of change in consumption, due to change in income. Symbolically, it is represented as:![]()
Where, ΔC = Change in consumption
ΔY = Change in income
Let us understand the concept with the given schedule: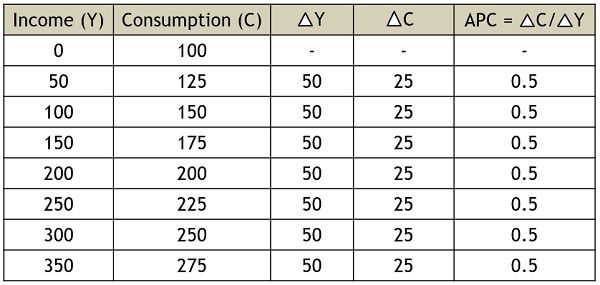
- Marginal Propensity Curve (MPC) between 0 to 1 (0 = MPC = 1).
- MPC may increase, decrease or remain the same, but they fall between zero and one.
- MPC is equal to one when all the increased income is consumed.
- MPC is equal to zero when all the increased income is saved, which is not possible as it is quite impractical.
- So, we can say that, on the consumption curve, the difference between any of the two points is called MPC. It is the slope of the consumption curve.
Also Read: Difference Between Individual Demand and Market Demand
Key Differences Between APC and MPC
As we have already discussed the meaning with examples and a schedule of the two types of propensity to consume. Let us understand the difference between APC and MPC.
- Average Propensity Consumption (APC) is the ratio of absolute consumption, in relation to absolute income, at a specific income level. On the other hand, Marginal Propensity to Consume (MPC) is the fraction of the change in disposable income which is used on consumption.
- APC is any point on the curve. Conversely, the difference of the two points on the consumption curve is called MPC.
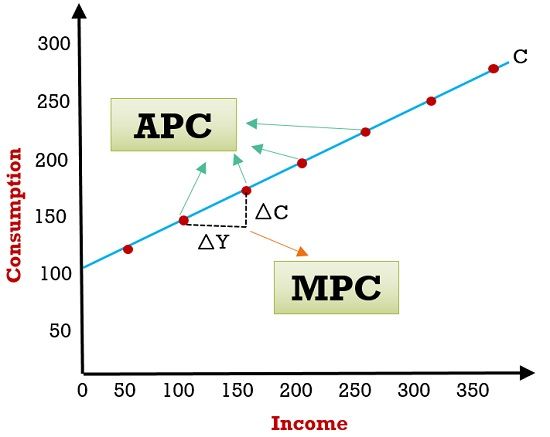
- APC can be more than one but this is not the case with MPC, because it cannot be more than one.
- When there is a shift in consumption schedule, but no change in the slope, it indicates APC. But when there is a change in slope of consumption schedule implies a change in MPC.
- For Example: Suppose the income of a person is 10000 and his consumption is 8000, so the APC is 0.8 representing that the consumer spends 80% of his income on the consumption of goods and services. But when his income is increased to 15000 and his consumption is increased to 12000. So, the change in income would be 5000 and the change in consumption would be 4000. So MPC would be 0.8. It indicates that 80% of the incremented income is used in consumption, while the rest is saved by the consumer.
What is the Consumption Function?
Consumption is vital for living, which mainly relies on income. That is to say, the level of income regulates the level of consumption in the economy. In this way, we can say that the consumption function is the functional relationship amidst two factors i.e. consumption and income.
It determines the quantitative dependence of consumption on a particular income level in the economy. It determines how consumption is quantitatively dependent on the particular level of income. Symbolically, it is denoted as:
C = f (Y)
Here, C is used to express consumption
f is for the function of or dependent upon
Y is used to express income
Conclusion
Both APC and MPC of poor is greater in comparison to rich. Further, consumption can never be equal to zero. This is because the least level of consumption is necessary for survival, which is termed autonomous consumption. Also, the consumption curve slopes in an upward direction showing the direct relationship between income and consumption of people.




Issahak Gbanzogu says
So excited.