 The fundamental difference between histogram and bar graph will help you to identify the two easily is that there are gaps between bars in a bar graph but in the histogram, the bars are adjacent to each other.
After the collection and verification of data, it needs to be compiled and displayed in such a way that it highlights the essential features clearly to the users. The statistical analysis can only be performed if it is properly presented. There are three modes of presentation of data i.e. textual presentation, tabular presentation, and diagrammatic presentation. The diagrammatic representation of data is one of the best and attractive way of presenting data as it caters both educated and uneducated section of the society.
Bar Graph and Histogram are the two ways to display data in the form of a diagram. As they both use bars to display data, people find it difficult to differentiate the two.
Content: Histogram vs Bar Graph
Comparison Chart
| Basis for Comparison | Histogram | Bar graph |
|---|---|---|
| Meaning | Histogram refers to a graphical representation, that displays data by way of bars to show the frequency of numerical data. | Bar graph is a pictorial representation of data that uses bars to compare different categories of data. |
| Indicates | Distribution of non-discrete variables | Comparison of discrete variables |
| Presents | Quantitative data | Categorical data |
| Spaces | Bars touch each other, hence there are no spaces between bars | Bars do not touch each other, hence there are spaces between bars. |
| Elements | Elements are grouped together, so that they are considered as ranges. | Elements are taken as individual entities. |
| Can bars be reordered? | No | Yes |
| Width of bars | Need not to be same | Same |
Definition of Histogram
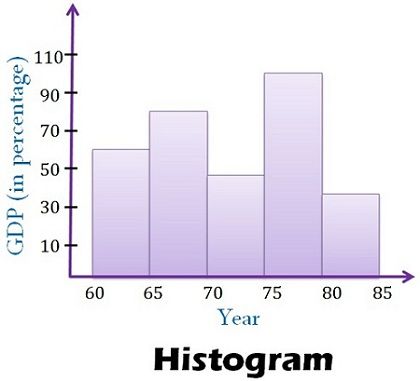
In statistics, Histogram is defined as a type of bar chart that is used to represent statistical information by way of bars to show the frequency distribution of continuous data. It indicates the number of observations which lie in-between the range of values, known as class or bin.
The first step, in the construction of histogram, is to take the observations and split them into logical series of intervals called bins. X-axis indicates, independent variables i.e. classes while the y-axis represents dependent variables i.e. occurrences. Rectangle blocks i.e. bars are depicted on the x-axis, whose area depends on the classes. See figure given below:
Definition of Bar graph
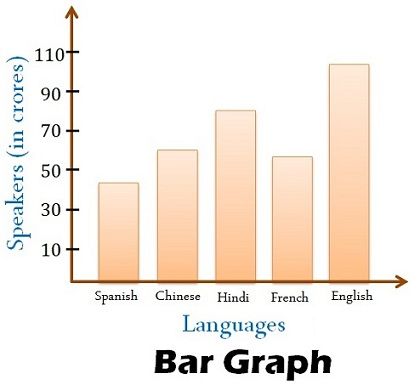
A bar graph is a chart that graphically represents the comparison between categories of data. It displays grouped data by way of parallel rectangular bars of equal width but varying the length. Each rectangular block indicates specific category and the length of the bars depends on the values they hold. The bars in a bar graph are presented in such a way that they do not touch each other, to indicate elements as separate entities.
Bar diagram can be horizontal or vertical, where a horizontal bar graph is used to display data varying over space whereas the vertical bar graph represents time series data. It contains two axis, where one axis represents the categories and the other axis shows the discrete values of the data. See figure given below:
Key Differences Between Histogram and Bar graph
The differences between histogram and bar graph can be drawn clearly on the following grounds:
- Histogram refers to a graphical representation; that displays data by way of bars to show the frequency of numerical data. A bar graph is a pictorial representation of data that uses bars to compare different categories of data.
- A histogram represents the frequency distribution of continuous variables. Conversely, a bar graph is a diagrammatic comparison of discrete variables.
- Histogram presents numerical data whereas bar graph shows categorical data.
- The histogram is drawn in such a way that there is no gap between the bars. On the other hand, there is proper spacing between bars in a bar graph that indicates discontinuity.
- Items of the histogram are numbers, which are categorised together, to represent ranges of data. As opposed to the bar graph, items are considered as individual entities.
- In the case of a bar graph, it is quite common to rearrange the blocks, from highest to lowest. But with histogram, this cannot be done, as they are shown in the sequences of classes.
- The width of rectangular blocks in a histogram may or may not be same while the width of the bars in a bar graph is always same.
Conclusion
Prima facie both the two graphs seem alike, as both bar graph, and histogram has an x-axis and y-axis and uses vertical bars to display data. The height of the bars is decided by its relative frequency of the amount of data in the element. Moreover, skewness does matter in histogram but not in the case of a bar graph.


shantosisir says
it is good website for learning .
Otto says
This was very not helpful
Rohit says
Very good 👍👌👌👌
Raghav Sharma says
Quite helpful for what I was looking for =)
Nyree O' Sullivan says
Thank you very helpful.
Linda says
Great summary. My stats teacher explained some of these concepts but the continuous vs. discrete was not discussed and the fact that bar graphs have gaps between the bars, and why, was very helpful.
Ben says
Thanks 👍👍👍👍
p.pavankalyan says
And It is easy to understand the subject clearly and politly
Dorothy says
Thank you. Very helpful
vicky says
its really helpfulul
nathaniel b says
this article helped solve world hunger