 In statistics vocabulary, we often deal with the terms parameter and statistic, which play a vital role in the determination of the sample size. Parameter implies a summary description of the characteristics of the target population. On the other extreme, the statistic is a summary value of a small group of population i.e. sample.
The parameter is drawn from the measurements of units in the population. As against this, the statistic is drawn from the measurement of the elements of the sample.
While studying statistics it is important to the concept and difference between parameter and statistic, as these are commonly misconstrued.
Content: Statistic Vs Parameter
Comparison Chart
| Basis for Comparison | Statistic | Parameter |
|---|---|---|
| Meaning | Statistic is a measure which describes a fraction of population. | Parameter refers to a measure which describes population. |
| Numerical value | Variable and Known | Fixed and Unknown |
| Statistical Notation | x̄ = Sample Mean | μ = Population Mean |
| s = Sample Standard Deviation | σ = Population Standard Deviation | |
| p̂ = Sample Proportion | P = Population Proportion | |
| x = Data Elements | X = Data Elements | |
| n = Size of sample | N = Size of Population | |
| r = Correlation coefficient | ρ = Correlation coefficient |
Definition of Statistic
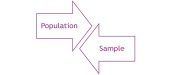
A statistic is defined as a numerical value, which is obtained from a sample of data. It is a descriptive statistical measure and function of sample observation. A sample is described as a fraction of the population, which represents the entire population in all its characteristics. The common use of statistic is to estimate a particular population parameter.
From the given population, it is possible to draw multiple samples, and the result (statistic) obtained from different samples will vary, which depends on the samples.
Definition of Parameter
A fixed characteristic of population based on all the elements of the population is termed as the parameter. Here population refers to an aggregate of all units under consideration, which share common characteristics. It is a numerical value that remains unchanged, as every member of the population is surveyed to know the parameter. It indicates true value, which is obtained after the census is conducted.
Key Differences Between Statistic and Parameter
The difference between statistic and parameter can be drawn clearly on the following grounds:
- A statistic is a characteristic of a small part of the population, i.e. sample. The parameter is a fixed measure which describes the target population.
- The statistic is a variable and known number which depend on the sample of the population while the parameter is a fixed and unknown numerical value.
- Statistical notations are different for population parameters and sample statistics, which are given as under:
- In population parameter, µ (Greek letter mu) represents mean, P denotes population proportion, standard deviation is labeled as σ (Greek letter sigma), variance is represented by σ2, population size is indicated by N, Standard error of mean is represented by σx̄, standard error of proportion is labeled as σp, standardized variate (z) is represented by (X-µ)/σ, Coefficient of variation is denoted by σ/µ.
- In sample statistics, x̄ (x-bar) represents mean, p̂ (p-hat) denotes sample proportion, standard deviation is labeled as s, variance is represented by s2, n denotes sample size, Standard error of mean is represented by sx̄, standard error of proportion is labeled as sp, standardized variate (z) is represented by (x-x̄)/s, Coefficient of variation is denoted by s/(x̄)
Illustration
- A researcher wants to know the average weight of females aged 22 years or older in India. The researcher obtains the average weight of 54 kg, from a random sample of 40 females.
Solution: In the given situation, the statistics are the average weight of 54 kg, calculated from a simple random sample of 40 females, in India while the parameter is the mean weight of all females aged 22 years or older. - A researcher wants to estimate the average amount of water consumed by male teenagers in a day. From a simple random sample of 55 male teens the researcher obtains an average of 1.5 litres of water.
Solution: In this question, the parameter is the average amount of water consumed by all male teenagers, in a day whereas the statistic is the average 1.5 litres of water consumed in a day by male teens, obtained from a simple random sample of 55 male teens.
Conclusion
To sum up the discussion, it is important to note that when the result obtained from the population, the numerical value is known as the parameter. While, if the result is obtained from the sample, the numerical value is called statistic.
You Might Also Like:
 Difference Between Sample Mean and Population Mean
 Difference Between Standard Deviation and Standard Error
 Difference Between Population and Sample
 Difference Between Sampling and Non-Sampling Error
 Difference Between Probability and Non-Probability Sampling
 Difference Between ref and out parameter in c#
manoj raghuwanshi says
Hi Surbhi, it’s very informative and interesting before I go to my class
thanks, well try
best wishes
chisom says
good job
Uduak says
thanks so much. this is eyes opener
Asha Chawla says
Dear Surbhi
You are doing very good.
Mitch Rodriguez says
Dear Surbhi,
These notes are helping me a lot for my exam tomorrow….. Keep the great work ahead…
Thank you
Regards
Mitch Rodriguez
Gbedege Cornelius says
May you know no bounds. I’m grateful bcos what I found is what I sought to understand for a very long. Thank you
Ana Carol says
Great explanation