 In Horizontal Financial Analysis, the comparison is made between an item of financial statement, with that of the base year’s corresponding item. On the other hand, in vertical financial analysis, an item of the financial statement is compared with the common item of the same accounting period.
Financial Statement implies the formal and final summary of the financial affairs of the concern, indicating the performance, profitability, position, etc. The process of thoroughly analysing the information given in the financial statement, so as to estimate the present and past financial position, operational efficiency of the concern, is called financial statement analysis or financial analysis. Financial Analysis can be of two types, i.e. Horizontal Analysis and Vertical Analysis
Now let’s discuss the differences between horizontal and vertical analysis.
Content: Horizontal Vs Vertical Analysis
Comparison Chart
| Basis for Comparison | Horizontal Analysis | Vertical Analysis |
|---|---|---|
| Meaning | Horizontal analysis is the comparative evaluation of the financial statement for two or more period, to calculate the absolute and relative variances for every line of item. | Vertical analysis is proportional evaluation of the financial statement wherein each item on the statement is expressed as a percentage of the total, in the respective section. |
| Use | It represents the growth or decline of an item. | It helps in forecasting and determining the relative proportion of an item to the common item in the financial statement. |
| Aims at | Ascertaining the trend and changes in an item over time. | It aims at ascertaining the proportion of items to the common item of the single accounting year. |
| Expresses | Item from past financial statement are restated to a percentage of amount from base year. | Each item of financial statement is denoted as a percentage of another item. |
| Comparison | Helpful in intra-firm comparison | Helpful in both intra-firm comparison and inter-firm comparison |
Definition of Horizontal Analysis
Horizontal Analysis is that type of financial statement analysis in which an item of financial statement of a particular year is analysed and interpreted after making its comparison with that of another year’s corresponding item.
It is a useful tool for gauging the trend and direction over the period. In this analysis, the line of items is compared in comparative financial statements or ratios over the reporting periods, so as to record the overall rise or fall in the company’s performance and profitability.
Comparative financial statements reflect the profitability and financial status of the concern for various accounting years in a comparative manner. It should be kept in mind that the data of two or more financial years can be compared only when the accounting principles are the same for the respective years.
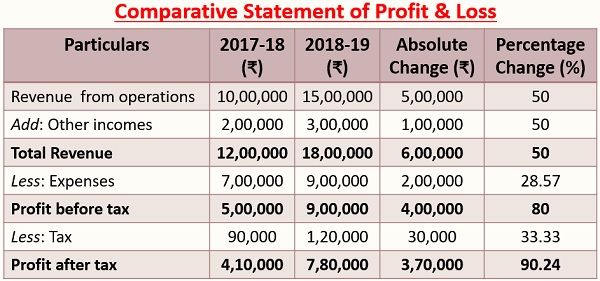
In this analysis, the very first year is considered as the base year and the entities on the statement for the subsequent period are compared with those of the entities on the statement of the base period. The changes are depicted both in absolute figures and in percentage terms.
Definition of Vertical Analysis
Vertical Analysis refers to the analysis of the financial statement in which each item of the statement of a particular financial year is analysed, by comparing it with a common item. So, it is also known as common-size analysis.
In vertical analysis, the line of items on a balance sheet can be expressed as a proportion or percentage of total assets, liabilities or equity. However, in the case of the income statement, the same may be indicated as a percentage of gross sales, while in cash flow statement, the cash inflows and outflows are denoted as a proportion of total cash inflow.
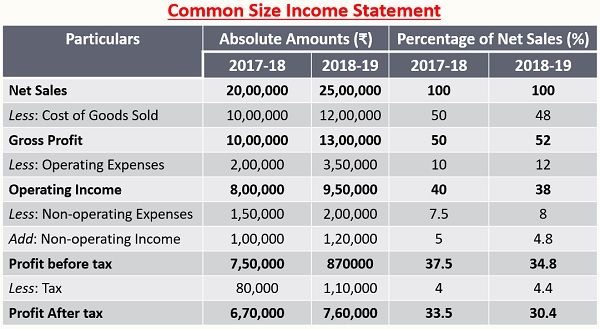
For this purpose, common size financial statements are used, wherein the correlation of various items of the statement with a common item is denoted as a percentage of that common item, i.e. the bottom line
With the help of this analysis, the percentages so computed can be directly compared with the result of the equivalent percentages of the past years or other companies operating in the same industry, irrespective of their size. So, common size financial statement not only helps in intra-firm comparison but also in inter-firm comparison.
Key Differences Between Horizontal and Vertical Analysis
The difference between horizontal and vertical analysis can be drawn clearly on the following grounds:
- Horizontal Analysis refers to the process of comparing the line of items over the period, in the comparative financial statement, to track the overall trend and performance. On the other hand, vertical analysis refers to the tool used to study financial statement by making a comparison of each line of the item as a proportion of the base figure within the statement, i.e. assets, liabilities, sales or equity.
- Horizontal Analysis is undertaken to ascertain how the company performed over the years or what is its financial status, as compared to the prior period. As against, vertical analysis is used to report the stakeholder about the portion of line items to the total, in the current financial year.
- The primary aim of horizontal analysis is to keep a track on the behaviour of the individual items of the financial statement over the years. Conversely, the vertical analysis aims at showing an insight into the relative importance or proportion of various items on a particular year’s financial statement.
- In horizontal analysis, the items of the present financial year are compared with the base year’s amount, in both absolute and percentage terms. On the contrary, in vertical analysis, each item of the financial statement is compared with another item of that financial statement.
- The horizontal analysis is helpful in comparing the results of one financial year with that of another. As opposed, the vertical analysis is used to compare the results of one company’s financial statement with that of another, of the same industry. Further, vertical analysis can also be used for the purpose of benchmarking.
Example
Horizontal Analysis
 Formula Used:

Vertical Analysis
 Formula Used:

Conclusion
Financial Analysis is helpful in accurately ascertaining and forecasting future trends and conditions. The primary aim of horizontal analysis is to compare line items in order to ascertain the changes in trend over time. As against, the aim of vertical analysis is to ascertain the proportion of item, in relation to a common item in percentage terms.
The two analysis are helpful in getting a clear picture of the financial health and performance of the company.


Leave a Reply