 To make the generalisation about the population from the sample, statistical tests are used. A statistical test is a formal technique that relies on the probability distribution, for reaching the conclusion concerning the reasonableness of the hypothesis. These hypothetical testing related to differences are classified as parametric and nonparametric tests.The parametric test is one which has information about the population parameter.
On the other hand, the nonparametric test is one where the researcher has no idea regarding the population parameter. So, take a full read of this article, to know the significant differences between parametric and nonparametric test.
Content: Parametric Test Vs Nonparametric Test
Comparison Chart
| Basis for Comparison | Parametric Test | Nonparametric Test |
|---|---|---|
| Meaning | A statistical test, in which specific assumptions are made about the population parameter is known as parametric test. | A statistical test used in the case of non-metric independent variables, is called non-parametric test. |
| Basis of test statistic | Distribution | Arbitrary |
| Measurement level | Interval or ratio | Nominal or ordinal |
| Measure of central tendency | Mean | Median |
| Information about population | Completely known | Unavailable |
| Applicability | Variables | Variables and Attributes |
| Correlation test | Pearson | Spearman |
Definition of Parametric Test
The parametric test is the hypothesis test which provides generalisations for making statements about the mean of the parent population. A t-test based on Student’s t-statistic, which is often used in this regard.
The t-statistic rests on the underlying assumption that there is the normal distribution of variable and the mean in known or assumed to be known. The population variance is calculated for the sample. It is assumed that the variables of interest, in the population are measured on an interval scale.
Definition of Nonparametric Test
The nonparametric test is defined as the hypothesis test which is not based on underlying assumptions, i.e. it does not require population’s distribution to be denoted by specific parameters.
The test is mainly based on differences in medians. Hence, it is alternately known as the distribution-free test. The test assumes that the variables are measured on a nominal or ordinal level. It is used when the independent variables are non-metric.
Key Differences Between Parametric and Nonparametric Tests
The fundamental differences between parametric and nonparametric test are discussed in the following points:
- A statistical test, in which specific assumptions are made about the population parameter is known as the parametric test. A statistical test used in the case of non-metric independent variables is called nonparametric test.
- In the parametric test, the test statistic is based on distribution. On the other hand, the test statistic is arbitrary in the case of the nonparametric test.
- In the parametric test, it is assumed that the measurement of variables of interest is done on interval or ratio level. As opposed to the nonparametric test, wherein the variable of interest are measured on nominal or ordinal scale.
- In general, the measure of central tendency in the parametric test is mean, while in the case of the nonparametric test is median.
- In the parametric test, there is complete information about the population. Conversely, in the nonparametric test, there is no information about the population.
- The applicability of parametric test is for variables only, whereas nonparametric test applies to both variables and attributes.
- For measuring the degree of association between two quantitative variables, Pearson’s coefficient of correlation is used in the parametric test, while spearman’s rank correlation is used in the nonparametric test.
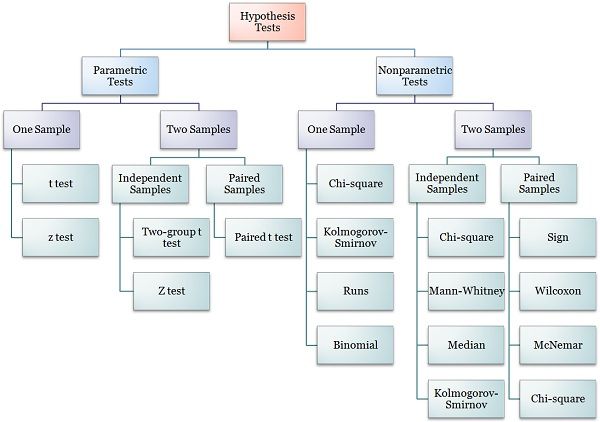
Hypothesis Tests Hierarchy
Equivalent Tests
| Parametric Test | Non-Parametric Test |
|---|---|
| Independent Sample t Test | Mann-Whitney test |
| Paired samples t test | Wilcoxon signed Rank test |
| One way Analysis of Variance (ANOVA) | Kruskal Wallis Test |
| One way repeated measures Analysis of Variance | Friedman's ANOVA |
Conclusion
To make a choice between parametric and the nonparametric test is not easy for a researcher conducting statistical analysis. For performing hypothesis, if the information about the population is completely known, by way of parameters, then the test is said to be parametric test whereas, if there is no knowledge about population and it is needed to test the hypothesis on population, then the test conducted is considered as the nonparametric test.


Poorvi says
Very nice article. students can clearly understand the actual concept.
Osoba Adunola says
The information is very detailed and easy to grab. Thanks
Sue Smith says
This is excellent. The flowchart was really helpful. Thank you.
Surbhi S says
We are really contented with your views, this means a lot, keep sharing.
Nyadenga wellington says
Great!. This clears off subject anxiety. keep sharing
tariro says
Thank u guys for simplifying this for us…. then u wonder why lecturers make it sound so hectic when things can be explained in such an easy to grasp way saving us the anxiety n pressure
Madan says
thank you
MD. MEHEDI HASAN says
These informations are very helpful to understand the concepts.
Thanks
Suparna says
Thank you very much for the information and the explanation you’ve given… It helped me to understand the topic much better.
Morrel says
Thank you!
Super Ball says
Information is clear to understand, very helpful. Thank you 🙂
Kimnna says
This is super helpful!
It is well detailed and easy to understand.
kakai brian says
am liking this site
it is great
Lillian Ramos says
This was extremely helpful on a very technical and difficult subject such as statistics.
Keith says
Please help me ….. I fail to understand what is meant if the question reads as follows:
State the parametric and non-parametric equivalent of the Wilcoxon Signed Rank Test
ABAH Augustine says
very informative and educating. nice one
Surbhi S says
Millions of thanks to all the readers of the page, for liking and sharing your valuable opinions with us, keep reading. 🙂
Sean says
This article is really helpful…
Cheers to Surbhi S for creating this article and pls do continue on creating articles like this…
Prakash Mistri says
very much effective documents. This material provides very good clarity on the parametric and non-parametric difference.
NORA says
thank you so much for making this more simplified
hanadi says
thank you for the simple yet detailed elaboration. million thanks you saved me.
Valsamma Cherian says
Thank you . For this is very simple and apt information
kinza batool malik says
its quite helpful and easy to understand..
Sally Morton says
Thank you so much for this article, especially the Hypothesis Test Hierarchy chart. I am reviewing statistics, and this chart serves as a roadmap.
Shahzad rauf says
Very helpful, I wll say awsome
Vishnu says
Very good content and clear explanation
Aqib says
Thanks for a wonderfully easy explanation….
DPN says
awesome
Omony Kamau says
Very precise and to the points. I just like it
Ashenafi Tadesse says
Yes!
savita says
thanku very much….. very very helpful especially the hypothesis test chart
Stella Nwodo says
This document is very simplified, thank you for the knowledge.
nompe jeminah sebeko cekwana says
Thank you very much, this information is clear and effective.
S.Sadiq Al-Alawi says
Thank you, very helpful, simply written, straight forward, easy to understand. I really liked it.