 There is a thin line of demarcation amidst t-test and ANOVA, i.e. when the population means of only two groups is to be compared, the t-test is used, but when means of more than two groups are to be compared, ANOVA is preferred.
T-test and Analysis of Variance abbreviated as ANOVA, are two parametric statistical techniques used to test the hypothesis. As these are based on the common assumption like the population from which sample is drawn should be normally distributed, homogeneity of variance, random sampling of data, independence of observations, measurement of the dependent variable on the ratio or interval level, people often misinterpret these two.
Here, is an article presented for you to understand the significant difference between t-test and ANOVA, have a look.
Content: T-test Vs ANOVA
Comparison Chart
| Basis for Comparison | T-test | ANOVA |
|---|---|---|
| Meaning | T-test is a hypothesis test that is used to compare the means of two populations. | ANOVA is a statistical technique that is used to compare the means of more than two populations. |
| Test statistic | (x ̄-µ)/(s/√n) | Between Sample Variance/Within Sample Variance |
Definition of T-test
The t-test is described as the statistical test that examines whether the population means of two samples greatly differ from one another, using t-distribution which is used when the standard deviation is not known, and the sample size is small. It is a tool to analyse whether the two samples are drawn from the same population.
The test is based on t-statistic, which assumes that variable is normally distributed (symmetric bell-shaped distribution) and mean is known and population variance is calculated from the sample.
In t-test null hypothesis takes the form of H0: µ(x) = µ(y) against alternative hypothesis H1: µ(x) ≠ µ(y), wherein µ(x) and µ(y) represents the population means. The degree of freedom of t-test is n1 + n2 – 2
Definition of ANOVA
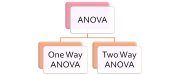
Analysis of Variance (ANOVA) is a statistical method, commonly used in all those situations where a comparison is to be made between more than two population means like the yield of the crop from multiple seed varieties. It is a vital tool of analysis for the researcher that enables him to conduct test simultaneously. When we use ANOVA, it is assumed that the sample is drawn from the normally distributed population and the population variance is equal.
In ANOVA, the total amount of variation in a dataset is split into two types, i.e. the amount allocated to chance and amount assigned to particular causes. Its basic principle is to test the variances among population means by assessing the amount of variation within group items, proportionate to the amount of variation between groups. Within the sample, the variance is because of the random unexplained disturbance whereas different treatment may cause between sample variance.
With the use of this technique, we test, null hypothesis (H0) wherein all population means are the same, or alternative hypothesis (H1) wherein at least one population mean is different.
Key Differences Between T-test and ANOVA
The significant differences between T-test and ANOVA are discussed in detail in the following points:
- A hypothesis test that is used to compare the means of two populations is called t-test. A statistical technique that is used to compare the means of more than two populations is known as Analysis of Variance or ANOVA.
- Test Statistic for T-test is:
 Test Statistic for ANOVA is:
Conclusion
After reviewing the above points, it can be said that t-test is a special type of ANOVA that can be used when we have only two populations to compare their means. Although the chances of errors might increase if t-test is used when we have to compare more than two means of the populations concurrently, that is why ANOVA is used


Isabella Ghement says
Nice post
Sophie M. says
It’s clear, and help a lot to remind the essential facts about these two analyses when you learned about them a long time ago.
Godwin says
This answer is so helpful for me…couldn’t have asked for more… Thanks
Manar Mizher says
Thanks for the valuable post.
It is clear now for me the difference between them.
Samuel says
Very invaluable! Thanks a lot.
Mike Tones says
If there are 5 different treatment applied to plots of a crop and you want to know which ones are different from each other, clearly you should use ANOVA. If one of those plots is a “control” and you are asking the question which of the treatments are significantly different from control, is it most appropriate to use ANOVA or to do multiple t-tests of each treatment in turn vs control? Thanks.
Ioannis Kamzolas says
Very clear explanation! Thanks a lot!
Bruce Berger says
This clears it up for me.- many thanks!
Sayo says
I have a test in two hours and I think you just saved my life so from the bottom of my heart, thank you
teecee says
On chapter two, experimental designs.. Thank for the help!
Maame says
Really appreciate the clear distinction you have drawn between the two tests. I am now really settled in my mind. Thanks
esmaeil says
Very invaluable! Thanks a lot.
Thanks for the valuable post.
Yumma Dorcas says
This is helpful. Thanks!
Ralph says
Having read from different sources, I so much love the simplicity you used for the explanations. You made it basic look basic and clear. Thanks.