 Collection of data is the first step in the field of research and once the collection process is complete the next step is to look for ways to condense and arrange the data, to study their characteristics. This process is known as the presentation of data. Data in its original form which the researcher first collects from research is termed ungrouped data.
In simple words, ungrouped data or raw data is a mere list of numbers that does not convey anything. This is because no summarization or aggregation is possible. On the other hand, grouped data refers to the data which is bundled together in different classes or categories.
What is Data?
Data refers to the fresh information or a set of given facts, in numerical figures collected by individuals or obtained from various sources for a specified purpose.
Also Read: Difference Between Data and Information
This write-up will help you in understanding the difference between ungrouped data and grouped data.
Content: Ungrouped Data Vs Grouped Data
Comparison Chart
| Basis for Comparison | Ungrouped Data | Grouped Data |
|---|---|---|
| Meaning | Data that is gathered for the first time during a study or experiment, is called Ungrouped data. | When raw data are grouped into classes, it is termed Grouped data. |
| Preferred when | Collecting data | Analyzing data |
| Classification | Not organized and Classified | Organized and Classified |
| Presentation | Use of lists | Use of frequency tables |
| Summary | No form of summarization | Summarized in the frequency distribution |
Definition of Ungrouped Data
Numerical Data available in its authentic form is called ungrouped data. It is a collection of observations that are gathered initially during the research by the investigator or obtained from the specified source. It is gathered as individual observations, commonly as a table or range of jumbled values.
As the data is presented in its actual form, computation, analysis, and interpretation is cumbersome process. So, one cannot arrive at any conclusion, unless the data is arranged in a specific order, i.e. ascending or descending, when the observations are in numerical form.
For Example: Let us say there are 30 women in a colony, whose age group are as follows:
55, 35, 29, 35, 24, 77, 65, 45, 26, 29, 35, 66, 57, 59, 33, 31, 64, 28, 63, 55, 25, 69, 46, 38, 48, 61, 37, 55, 24, 64
Data available in such a form is called raw data. And each entry i.e. 55, 35, 296, and so forth, is the value or observation.
Suppose we want to analyze the women who are above 35 years, the data presented in the above form does not provide sufficient information, such as the highest or lowest age. So, let us arrange this data in increasing order.
24, 24, 25, 26, 28, 29, 29, 31, 33, 35, 35, 35, 37, 38, 45, 46, 48, 55, 55, 55, 57, 59, 61, 63, 64, 64, 65, 66, 69, 77
Now, you must be wondering – what do we call this type of data?
Well, data given in this form is called arrayed data. An array is nothing but an arrangement of numerical observations in the order of magnitude. Plus, the difference between the largest and smallest number is the range.
When the number of observations is large, it becomes monotonous and time-consuming. Further, for easy understandability of the data, we will present it in tabular form i.e. frequency distribution table for raw data or ungrouped data.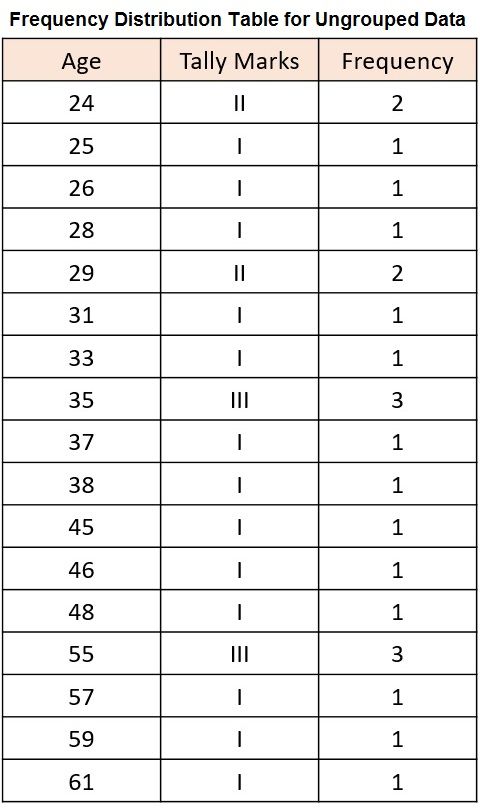
Here, the number of times each number occurs is called frequency.
What is Frequency Distribution?
A frequency distribution is the arrangement of data in tabular form which represents the frequency, with which each consecutive value of the variable occurs.
Also Read: Difference Between Qualitative and Quantitative Data
Definition of Grouped Data
When we assemble raw data into a number of classes, the resultant data is the grouped data. This is done to get a more condensed form of data. Data are grouped when the variable stretches over a wide range and there are a large number of observations, and it is not possible to arrange the data in any order, as it consumes a lot of time. Hence, it is pertinent to convert frequency into a class group called a class interval.
So, when the data are arranged in groups, it is called grouped data. A grouped frequency distribution indicates the number of times different values occur in different groups. When the data is arranged in this form, no information is lost.
Process of formation of Classes
To condense the given raw data into classes or groups, we follow these steps: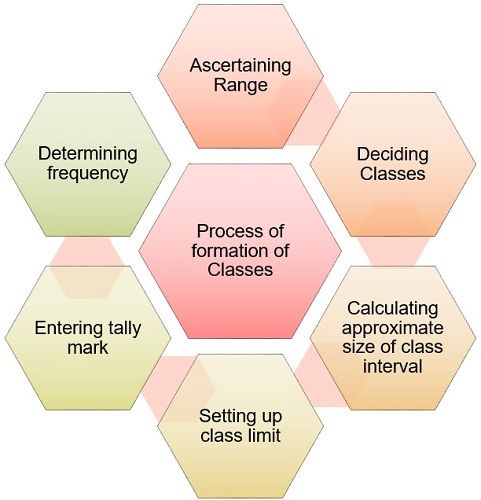
- Ascertain the range of raw data, i.e. difference between the maximum and minimum observation.
- Decide the total number of classes into which raw data is grouped, generally 5 to 10.
- Next, the range is divided by the intended number of classes to calculate the approximate size of the class interval.
- Set up class limits with the help of class intervals.
- Now take one observation from data at a time and enter a tally mark against the class of which it is a part. Further, to make it more convenient we will write down the tally mark in a bundle of five. The fifth one will strike the other four in a diagonal pattern.
- In our next step, we will count the tally marks in each class, to get the frequency of each class. It must be noted that the total of frequency should be equal to the total number of observations.
Kinds of Grouped Data
Grouped data is of two kinds: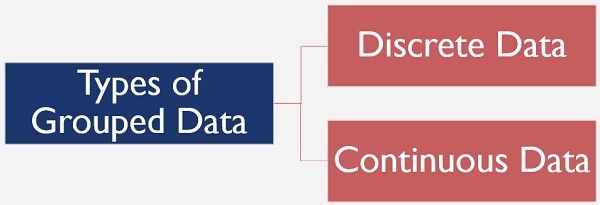
- Discrete Data: Use of discontinuous class intervals, is called discrete data, such as 1-10, 11 – 20, etc.
- Continuous Data: It is characterized by the use of continuous class limits. such as 0 – 10, 10 – 20, etc.
Also Read: Difference Between Discrete and Continuous Data
Presentation of Grouped Data
For Example: With the help of class intervals 1 – 10, 11 – 20, 21 – 30,…. Prepare the frequency distribution for the given data:
22, 65, 32, 36, 28, 17, 15, 64, 86, 52, 36, 55, 9, 48, 65, 96, 14, 6, 37, 69, 76, 49, 37, 46, 21, 67, 92, 98
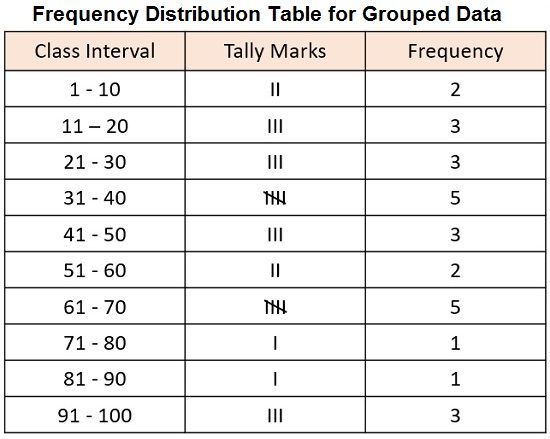
Here, the class represents 1 – 10, wherein both 1 and 10 are included.
Also Read: Difference Between Primary and Secondary Data
Key Differences Between Grouped Data and Ungrouped Data
After talking about the meaning and types of the two forms of data, let us understand the difference between grouped data and ungrouped data:
- Ungrouped data implies the data expressed in the form as it is gathered. On the other hand, when the displaced data is arranged in a condensed form by creating groups of the observations collected, is called grouped data.
- Ungrouped data is commonly preferred when data is collected by the researcher, as it is a simple list of numbers. As against, grouped data is preferred at the time of data analysis.
- Ungrouped data is not classified or organized into different classes, whereas grouped data is organized into a number of classes.
- Ungrouped data is presented in the form of lists, whereas, frequency tables are used to express, grouped data.
- Ungrouped data is not summarized, it is the original form of data, as it is collected by the researcher. Contrastingly, grouped data is summarized in a frequency distribution.
Prerequisites for the formation of classes
- There should be non-overlapping and continuous classes.
- There should not be any gaps amidst classes.
- The size of the classes should be the same.
- Avoid open-ended classes, such as less than 5 or more than 9
- Limits of each class have to be selected in a way that no confusion regarding which class a certain observation of the given data is a part of.
- A proper title should be given to the table so that it can convey exactly what the table is about.
Conclusion
Ungrouped data, as already said, is the data collected from the respondents in its actual form or as it is. The division of data into different classes is called grouped data.


Frank James Narra says
Thank you very much. It helps a lot
Bindeshwar S. Kushwaha says
Good article for understanding types of grouped data.